Time: 60 minutes
Audience: Developers & DevOps Personnel
Purpose: Introduce basic monitoring using Prometheus so you may apply new skills.
Goals:
- Instrument an application using Prometheus
- Visualize data using Grafana
Prerequisites
Before beginning these exercises, it is assumed that the student has a certain level of familiarity with Linux and the command-line, as well as Git commands.
Set Up The Environment
For this exercise, we will use a version of Linux (CentOS) provided by Hashicorp called a Bento Box. If you have experience with other virtual environments, you can use them.
Regardless of which environment is selected, it is assumed that some Linux command line skills are possessed.
If the selected environment is a physical environment, skip ahead to download the correct version of Prometheus for your OS. If a virtual environment is selected, please follow the following steps.
A host operating system is the OS the virtual environment will run on. The guest is the virtual environment.
Virtual Box and Vagrant
- Download the appropriate version of Virtual Box and the VM VirtualBox Extension Pack.
- Install Virtual Box according to the instructions for your host Operating System.
- Download the appropriate version of Vagrant for the host operating system you downloaded for Virtual Box. (For Windows, you will want the 64-bit version for any OS Windows 7 and up.)
- Install Vagrant according to the instructions for your host Operating System.
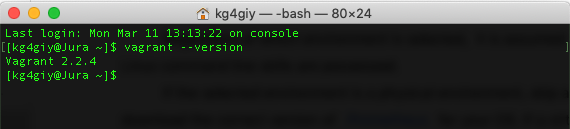
- Verify that Vagrant installed correctly. Open a command line (Terminal) and type
vagrant --version
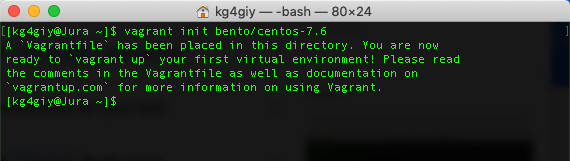
- Fetch an appropriate Vagrant box. A network connection from the host is needed for this. For this exercise, we will use the CentOS 7.6 Bento Box. To get the box, type
vagrant init bento/centos-7.6 :
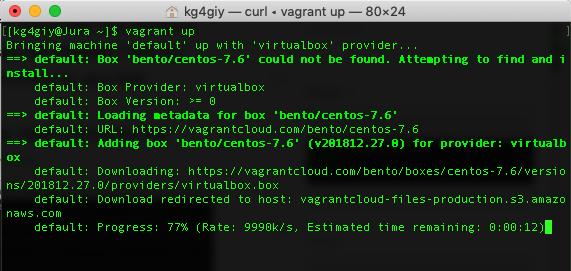
- Everything is ready, start the box. Type:
vagrant up
- Verify there are no errors. If not the box started successfully, if there are errors, check them carefully. Any errors are likely related to networking issues, or limits on the access to the PC.
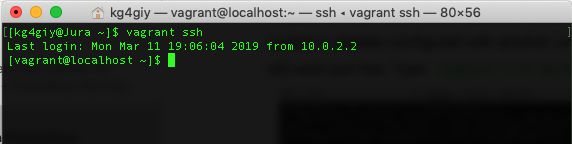
- Once the Virtual Box is up, log in. Open a command prompt and type
vagrant ssh
It is important to put vagrant in front of the ssh command so it finds the key correctly to log in. Feel free to tour around inside the guest.
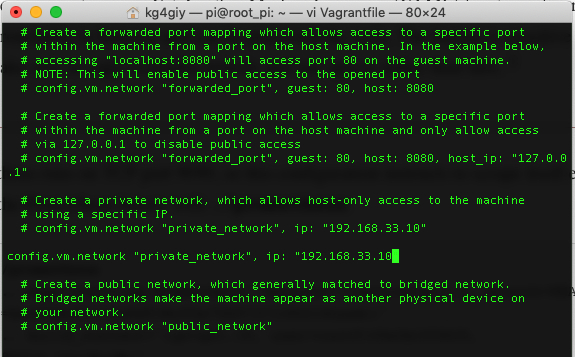
- In order to access the Prometheus web port it is necessary to modify the Vagrant file, usually located in the root folder of the host’s home directory. Either
~/Vagrantfile on a Mac, or C:\Users\username. Look for the line: # config.vm.network "private_network", ip: "192.168.33.10". The comment # can be removed, or the line retyped. Any valid IP address can be used.
- Reload the guest. Type:
vagrant reload.
Add Git
You will need to add the git application on the virtual machine.
- Ensure you are logged into the guest with
vagrant ssh - Type
$ sudo yum install git -y - It will install about 32 packages and quit without error.
Add Docker
To demonstrate the Java metrics and Grafana, we will install a Docker container with some prebaked examples, but to run them, we need to install Docker.
- Install the needed packages.
$ sudo yum install -y yum-utils device-mapper-persistent-data lvm2 - Configure the repository.
$ sudo yum-config-manager --add-repo https://download.docker.com/linux/centos/docker-ce.repo - Install the Docker Community Version.
$ sudo yum install docker-ce - Add the User to the Docker group.
$ sudo usermod -aG docker $(whoami) - Set Docker to start at boot.
$ sudo systemctl enable docker.service - Start Docker.
$ sudo systemctl start docker.service
For this exercise we will not need Docker Compose.
Install Prometheus
- Visit the Prometheus website and download the most recent version of Prometheus for AMD64 Linux platforms (for example prometheus-2.9.2.linux-amd64.tar.gz).
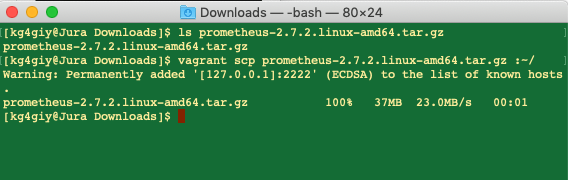
- Transfer the binary to your guest. This can be done via SCP. On the host OS, install the vagrant-scp plugin. Type:
vagrant plugin install vagrant-scp Then type: vagrant scp local_file_path_in_HostOS :remote_file_path_in_GuestOS. For example: vagrant scp prometheus-2.7.2.linux-amd64.tar.gz :~/ (If your guestOS is not running you will get an error message. You can type vagrant up to start it).
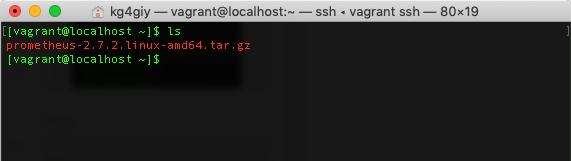
- The SCP will put the binary in the root of the home directory of the default (vagrant) user.
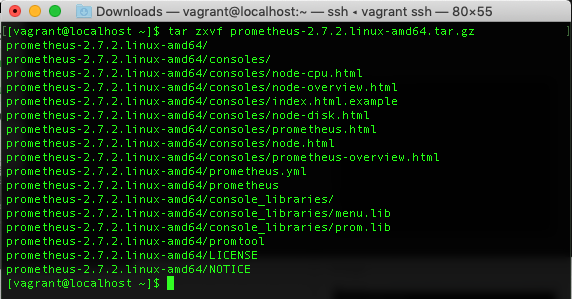
- Untar the file. Type
tar -zxvf prometheus-2.7.2.linux-amd64.tar.gz
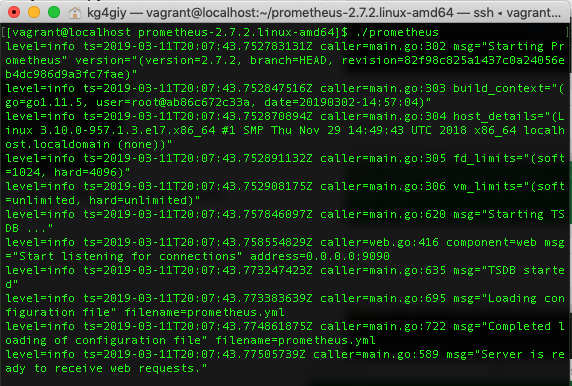
- Change into the Prometheus directory. You can test Prometheus by typing
$ ./prometheus which will spin up a number of messages like:
And then type <CTRL>-C to stop it, for now.
Instrumenation
Adding Java instrumentation to your code can be managed in a couple of ways. As we discussed in the class, we have the following examples.
Counter Example
import io.prometheus.client.Counter;
class YourClass {
  static final Counter requests = Counter.build()
     .name("requests_total").help("Total requests.").register();

  void processRequest() {
    requests.inc();
    // Your code here.
  }
}
Gauge Example
class YourClass {
  static final Gauge inprogressRequests = Gauge.build()
     .name("inprogress_requests").help("Inprogress requests.").register();

  void processRequest() {
    inprogressRequests.inc();
    // Your code here.
    inprogressRequests.dec();
  }
}
Putting it all together
import io.prometheus.client.Counter;
import io.prometheus.client.Gauge;
import io.prometheus.client.Histogram;
import io.prometheus.client.Summary;
import io.prometheus.client.exporter.HTTPServer;

import java.io.IOException;
import java.util.Random;

public class Main {

   private static double rand(double min, double max) {
       return min + (Math.random() * (max - min));
   }

   public static void main(String[] args) {
       Counter counter = Counter.build().namespace("java").name("my_counter").help("This is my counter").register();
       Gauge gauge = Gauge.build().namespace("java").name("my_gauge").help("This is my gauge").register();
       Histogram histogram = Histogram.build().namespace("java").name("my_histogram").help("This is my histogram").register();
       Summary summary = Summary.build().namespace("java").name("my_summary").help("This is my summary").register();

       Thread bgThread = new Thread(() -> {
           while (true) {
               try {
                   counter.inc(rand(0, 5));
                   gauge.set(rand(-5, 10));
                   histogram.observe(rand(0, 5));
                   summary.observe(rand(0, 5));


                   Thread.sleep(1000);
               } catch (InterruptedException e) {
                   e.printStackTrace();
               }
           }
       });
       bgThread.start();

       try {

           HTTPServer server = new HTTPServer(8080);
       } catch (IOException e) {
           e.printStackTrace();
       }
   }
}
Using io.prometheus
You can also modify the build to include the appropriate repository. For Maven, you edit your POM.XML something like this:
<!-- The client -->
<dependency>
  <groupId>io.prometheus</groupId>
  <artifactId>simpleclient</artifactId>
  <version>0.6.0</version>
</dependency>
<!-- Hotspot JVM metrics-->
<dependency>
  <groupId>io.prometheus</groupId>
  <artifactId>simpleclient_hotspot</artifactId>
  <version>0.6.0</version>
</dependency>
<!-- Exposition HTTPServer-->
<dependency>
  <groupId>io.prometheus</groupId>
  <artifactId>simpleclient_httpserver</artifactId>
  <version>0.6.0</version>
</dependency>
<!-- Pushgateway exposition-->
<dependency>
  <groupId>io.prometheus</groupId>
  <artifactId>simpleclient_pushgateway</artifactId>
  <version>0.6.0</version>
</dependency>
For more examples, please consult the Prometheus Java Client page.
Java Metrics and Prometheus
A Docker container with the examples above can be installed.
- Type
$ git clone https://github.com/sysdiglabs/custom-metrics-examples - Type
$ sudo docker build custom-metrics-examples/prometheus/java -t prometheus-java
Depending on the state of your Docker container, it may rebuild itself while it downloads. This will take a couple of minutes.
- Type
$ sudo docker run -d --rm --name prometheus-java -p 8080:8080 -p 80:80 prometheus-java
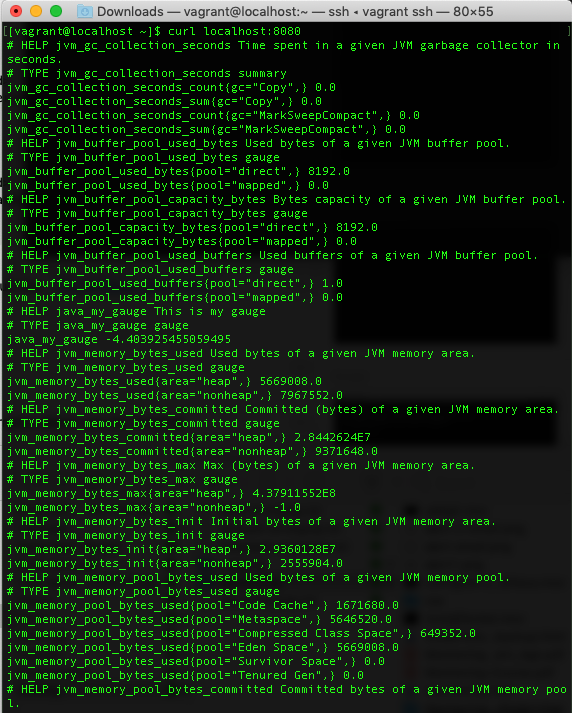
- Once you have a running container, check the available output by typing
$ curl localhost:8080 which will give you something like:
These are now exporting successfully from the application. Now we need to configure Prometheus.
- Change into the Prometheus directory
- Move or delete the
prometheus.yml file. This is the core configuration file for Prometheus.
This file is YAML (Yet Another Markup Language) and so spaces matter. Because our Java is being exported to port 8080, we will configure Prometheus to listen on 9090.
global:
  scrape_interval: 10s
scrape_configs:
 - job_name: prometheus
   static_configs:
    - targets:
       - localhost:9090
This is a basic configuration.
global: Defines the global parameters for Prometheus operation. The scrape interval is the time, in seconds, between system scrapes. Prometheus defaults to one minute [1m] as the time between scrapes. For demonstration purposes we will use ten seconds. The actual time should be a balance between need for metrics and load on the system.
scrape_configs: Define job name, labels, and other things that define the scrape. It scrapes http by default, but can scrape other protocols as configured. There is also the ability to pass usernames and passwords if needed. The entire documented suite of variable is available in the Prometheus documents.
For this exercise, we will scrape the localhost, port 9090, every 10 seconds. The job name is prometheus. Save the YAML above as prometheus.yml, then start Prometheus with $ ./prometheus.
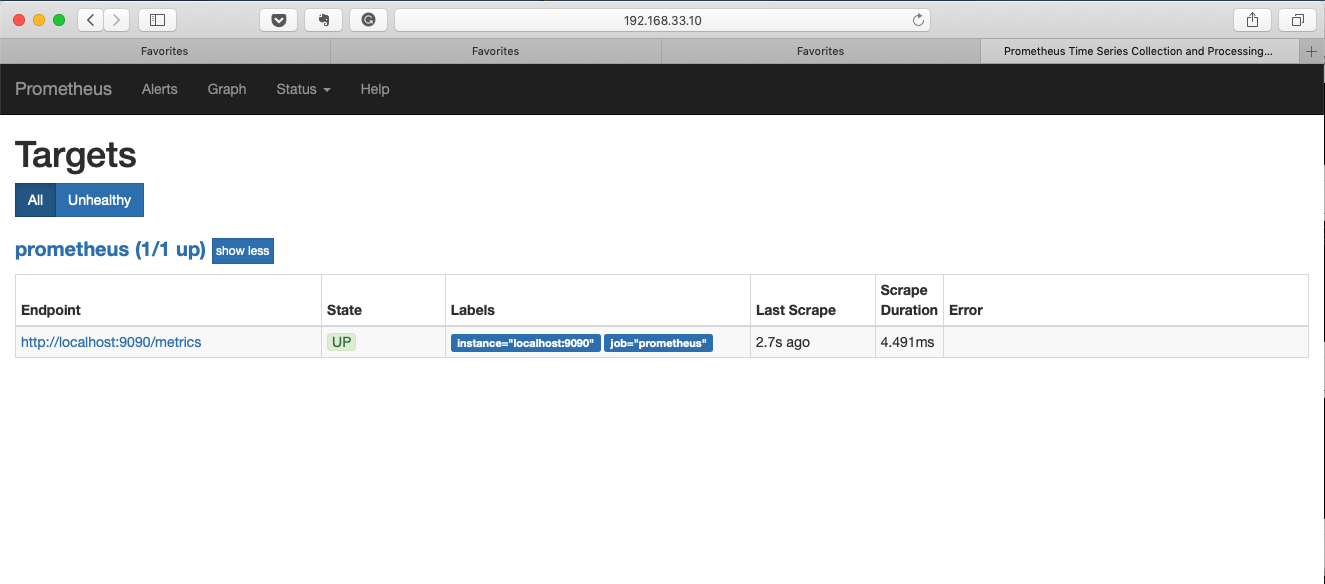
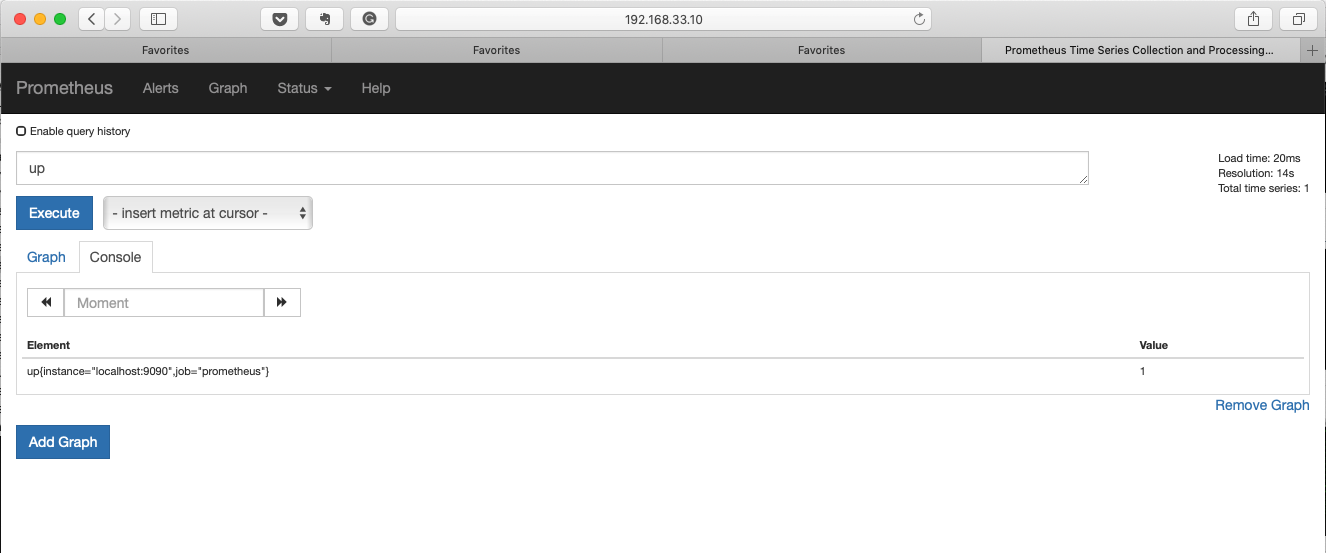
Open a web browser and point it at: 192.168.33.10:9090 (or the address you configured in Step 10 in setting up Vagrant). This is the main visualization page. From here you can examine a number of default metrics collected by Prometheus. You can verify the host status by clicking on Status | Targets, which will show you:
If you click on the Prometheus name, you will return to the PromQL Expression Browser main screen where you any type any number of PromQL (the Prometheus Query Language) queries. For example, by typing up will result in a returned value of 1, for up. This is useful for debugging.
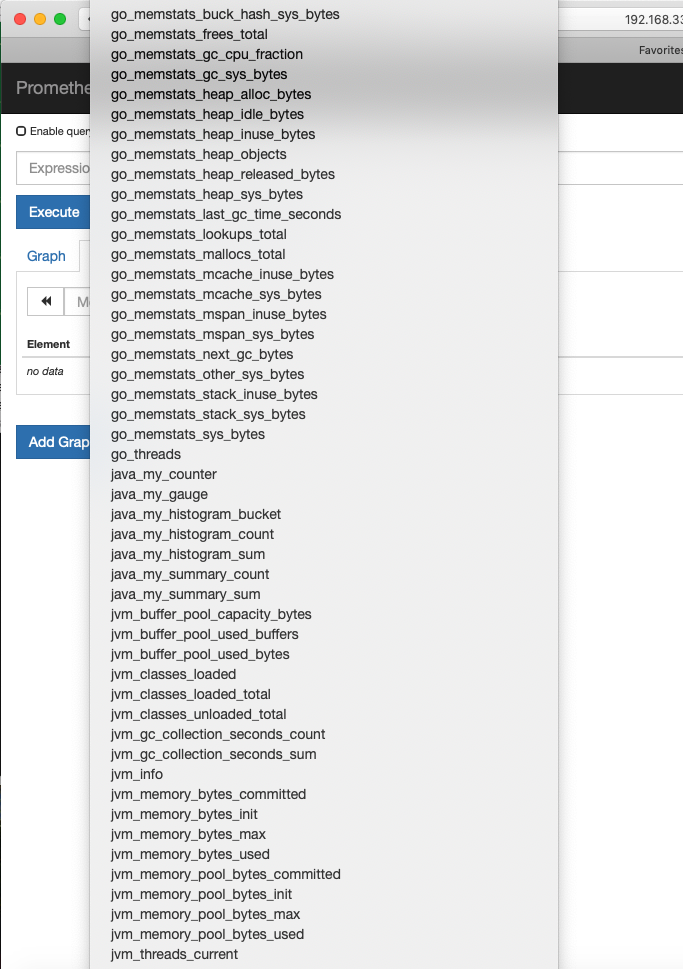
If you click on Insert Metric at Cursor, you can get an idea of the default metrics that can be viewed. You will notice there are no Java variables.
To add them:
- Stop Prometheus (<CTRL>-C)
- Edit the YAML file to add the 8080 port. It will look like this:
global:
  scrape_interval: 10s
scrape_configs:
 - job_name: prometheus
   static_configs:
    - targets:
       - localhost:9090
       - localhost:8080
- Restart Prometheus.
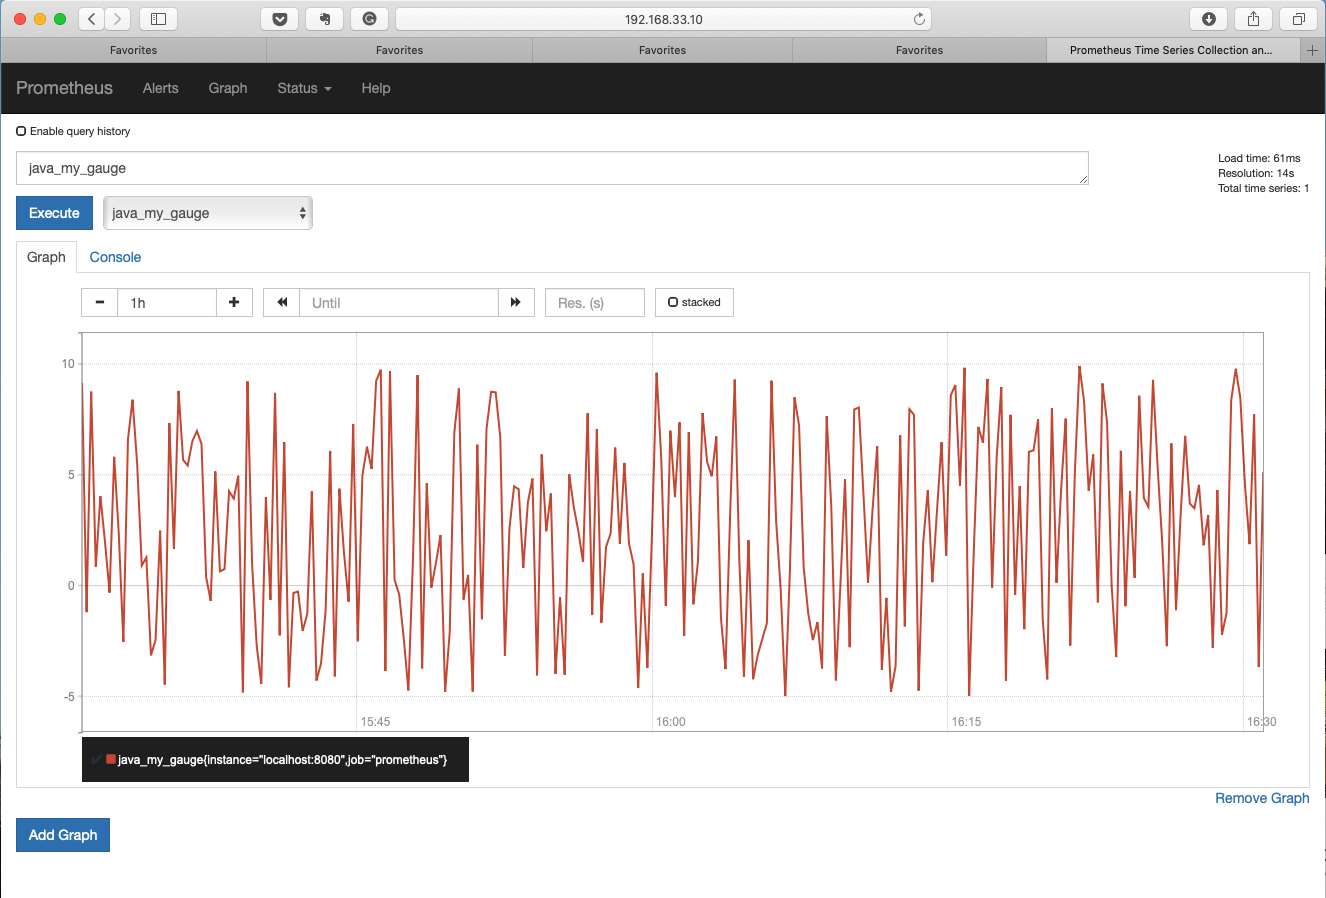
- Visit your browser and the Java variable will show up.
- You can visualize them with the built in graph feature (this view is after the Prometheus server has scrapped several cycles).
Prometheus configuration
There are hundreds of configuration options for Prometheus, including hosts and other library metrics. For example, if you have number of hosts, you might see a configuration like this:
global:
  scrape_interval: 10s
  evaluation_interval: 10s
rule_files:
 - rules.yml
scrape_configs:
 - job_name: prometheus
   static_configs:
    - targets:
       - localhost:9090
       - 192.168.1.181:9090
       - 192.168.1.183:9090
       - 192.168.1.184:9090
       - 192.168.1.181:8080
 - job_name: node
   static_configs:
    - targets:
       - localhost:9100
       - 192.168.1.181:9100
       - 192.168.1.183:9100
       - 192.168.1.184:9100
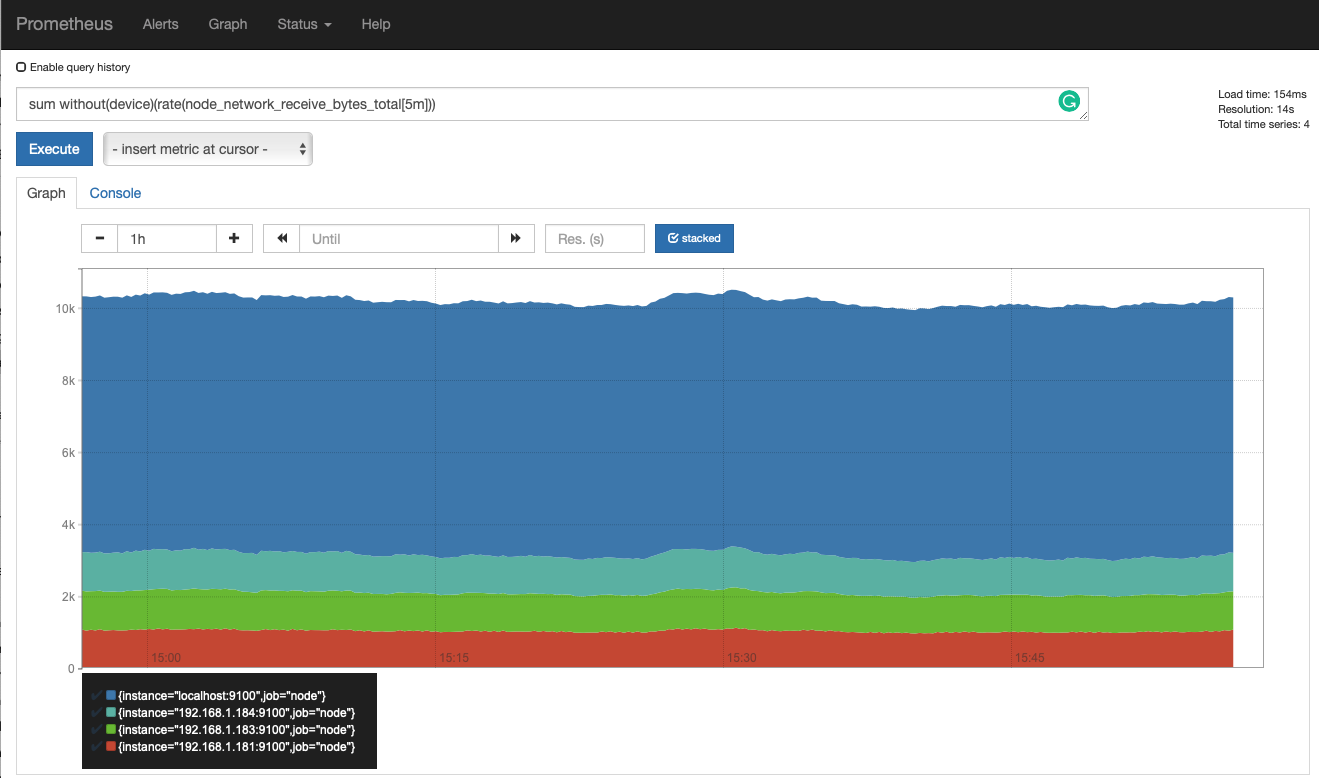
This configuration comes from a network with four instances of prometheus, collecting data from the node_exporter module (which exports metrics related to the OS, network, and other node related information. You would get a report like this if we aggregate network interfaces:
The Prometheus documentation provides a number of configuration suggestions, and there is a prometheus channel in Stack Overflow with just as many suggestions. There is also a great book available from O’Reilly’s Safari subscription Prometheus Up and Running.
Grafana
The Prometheus dashboard is handy for quick sanity checks, but it is not a great solution for long-term use. Enter Grafana, a popular tool for building just these sorts of dashboards.
The easiest way to plug into our existing configuration is to grab a copy of the Grafana Docker console. This will not use a volume mount so it is not a good long term solution.
$ sudo docker run -d --name=grafana --net=host grafana/grafana:5.0.0
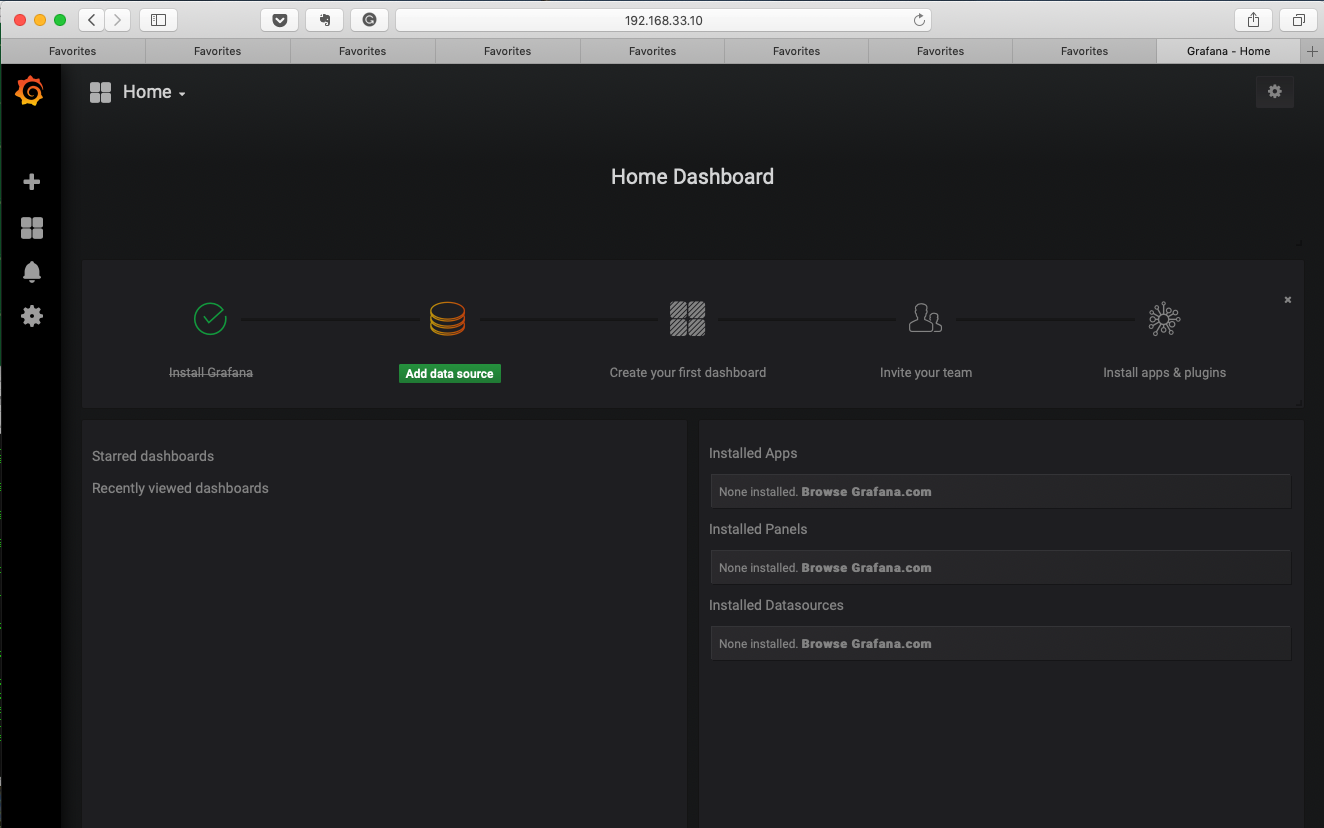
Grafana will present itself on port 3000. Log in as admin/admin
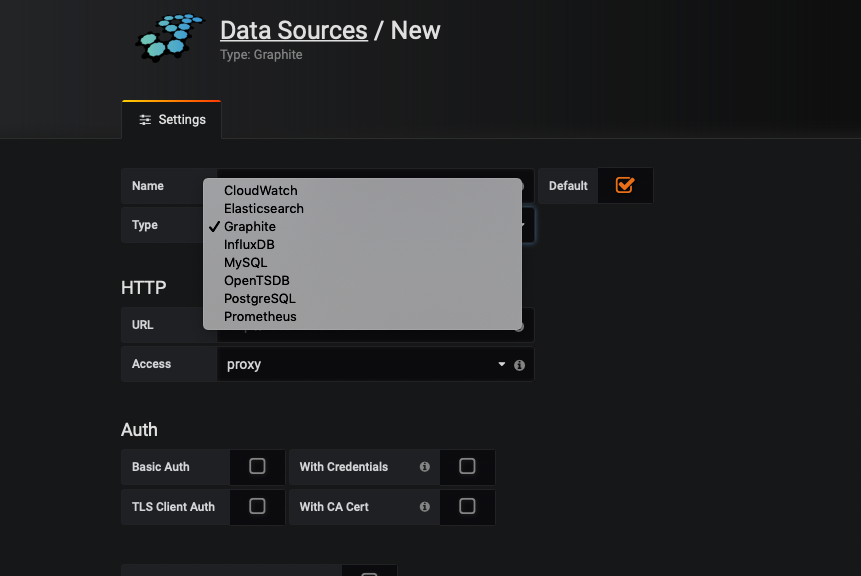
- Change the Data Source to Prometheus (you can name it whatever you want. I chose Prometheus)
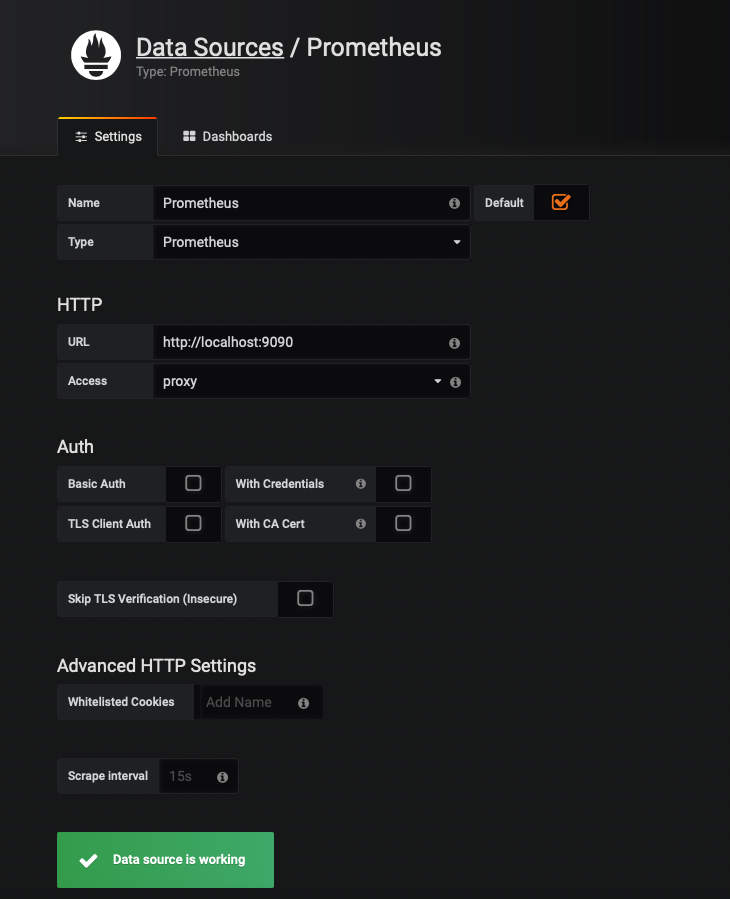
- Make sure to set your address correctly, click Save & Test and you will get this:
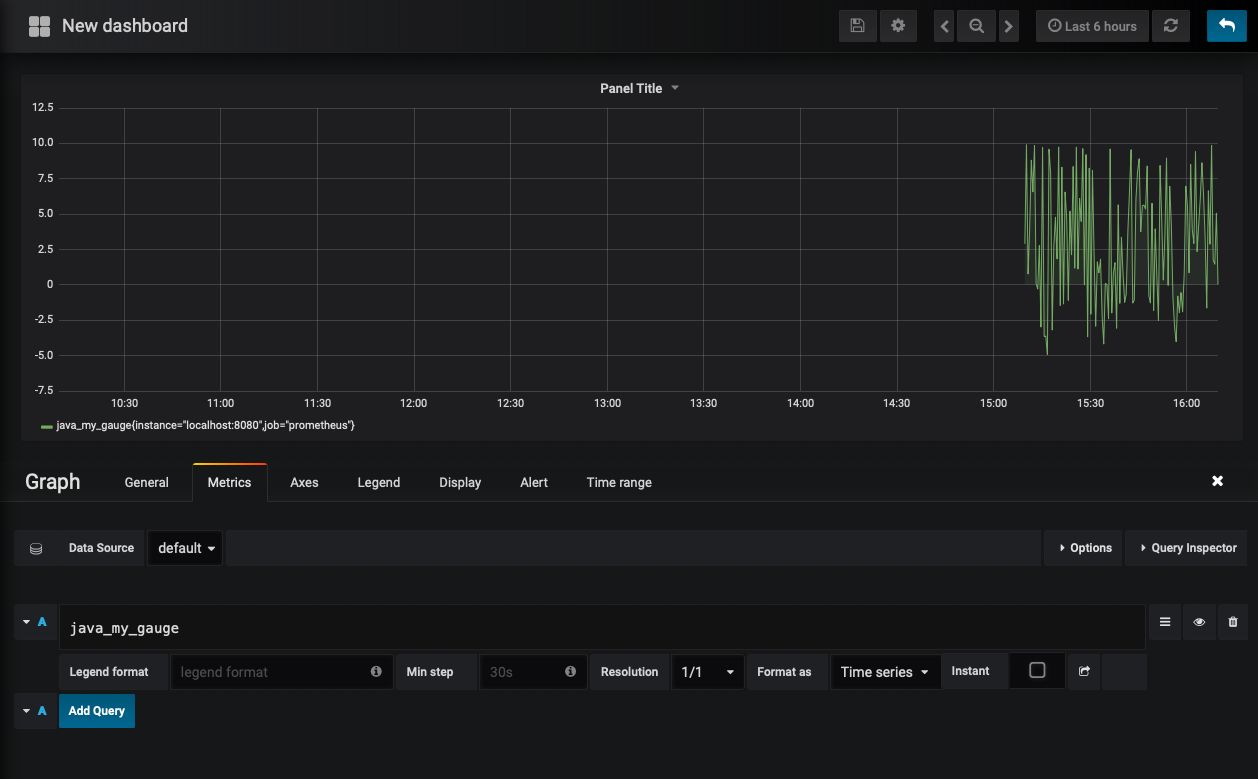
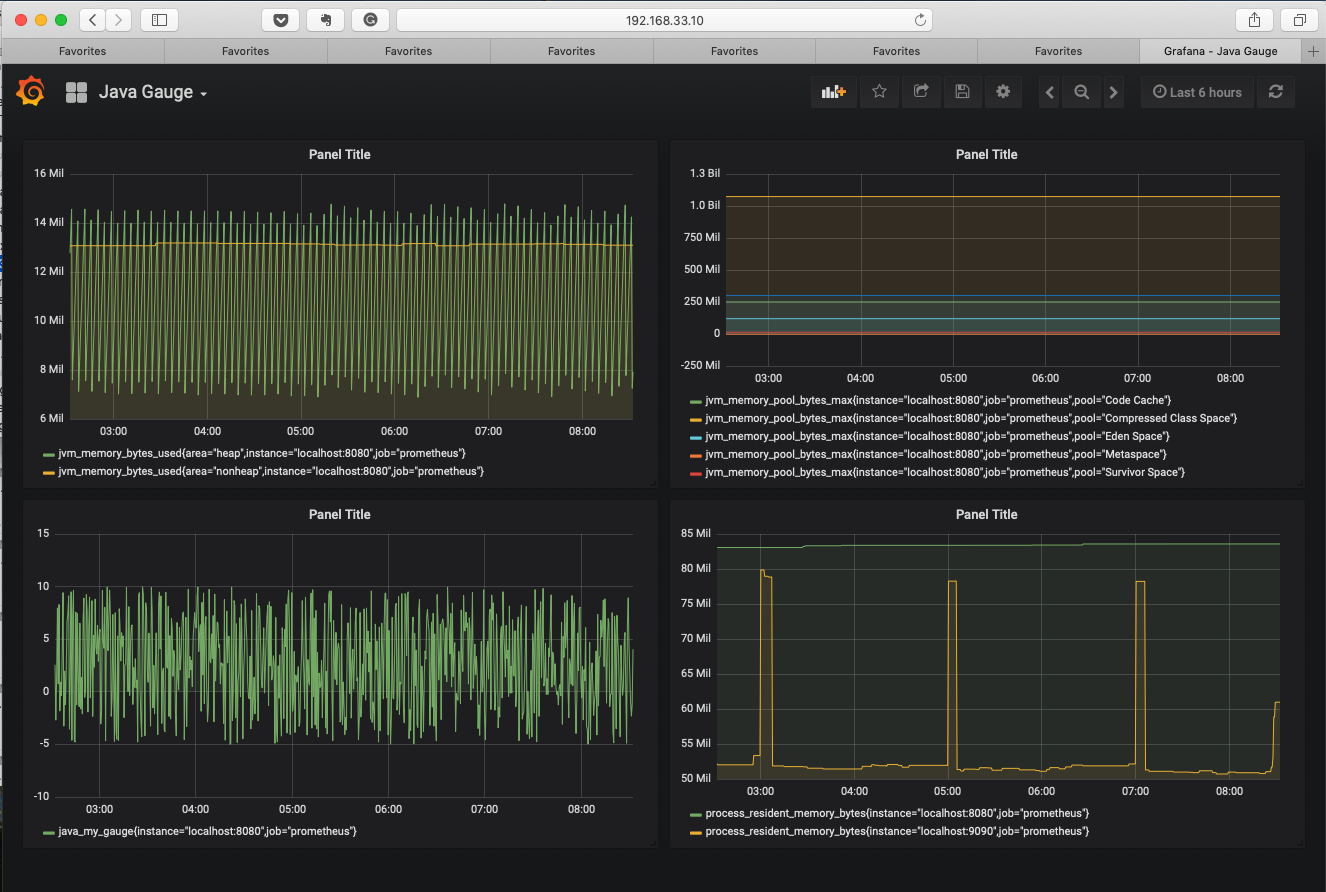
- Return to the dashboard, click edit and type in
java_my_guage and you will get something like this being pulled from your Prometheus instance.
- Over time, your graphs will begin to fill in.
Putting it all together
Now that you have an overview of the pieces, take some existing code and modify it to include counters or gauges as appropriate, build it, and then run it where Prometheus can capture the metrics. Once you have done that, validate that they are being picked up by looking in the Prometheus web page and then in Grafana.
Additional Exercises
- Investigate and look at
$ /home/vagrant/custom-metrics-examples/prometheus/java/src/main/java/Main.java in the custom-metrics-examples repository you cloned - Grab the Node_Exporter module, add it to your Prometheus engine and experiment with the variables.
- Try out some PromQL, for example
rate(node_network_receive_bytes_total[1m]) - Play with labels in Prometheus. How can they benefit you?
- Look at the alerting module. What changes would you need to make to the alertmanager.yml to make it work in your environment?
- Play with Grafana. What other visualizations can you create?
- This is not a course in how to use, or manipulate Virtual Box or Vagrant. If you need more help there is plenty of documentation on the Internet to help you out. Generally, both Virtual Box and Vagrant install without issues. ↩
- If you have other vagrant boxes configured, you will get an error about an existing Vagrant file. You can modify your existing Vagrant file to include this new box. ↩