
A couple of months ago, I found a program called Mermaid, which is a javascript framework for translating markdown into process diagrams, and other relationships diagrams. This is a really cool thing.
Most of us, at some point in their career has been forced to create a process diagram of some kind. Or maybe its an Entity Relationship Diagram (ERD) or diagram a user journey. In many cases, if it is a simple diagram, you will open your PowerPoint analog program and hope you can make the boxes and arrows do what you want them to do. For more complicated diagrams, you probably opened a custom diagraming tool, like Lucid, or Miro, or Visio.
The largest problem with all of these tools is keeping the diagram current. The second problem is sharing the document. While many people think everyone runs Microsoft Office, the reality is that Office, and its analogs are falling behind the state of the art. Producing documents on tablets and phones need lighter weight applications, and what is lighter weight than raw text?
Markdown, properly parsed, can create elegant, multi-platform documents that can be managed in standard version control systems without a large amount of syntactic overhead associated with even the lightest weight outputs from applications like Word. Markdown supports PDFs, web pages, scripts, tables, and now, with Mermaid, complex diagrams!
Because of the various levels of support in browsers, and operating systems, there are many different ways to parse the data so everyone can see it. Let’s look at an example.
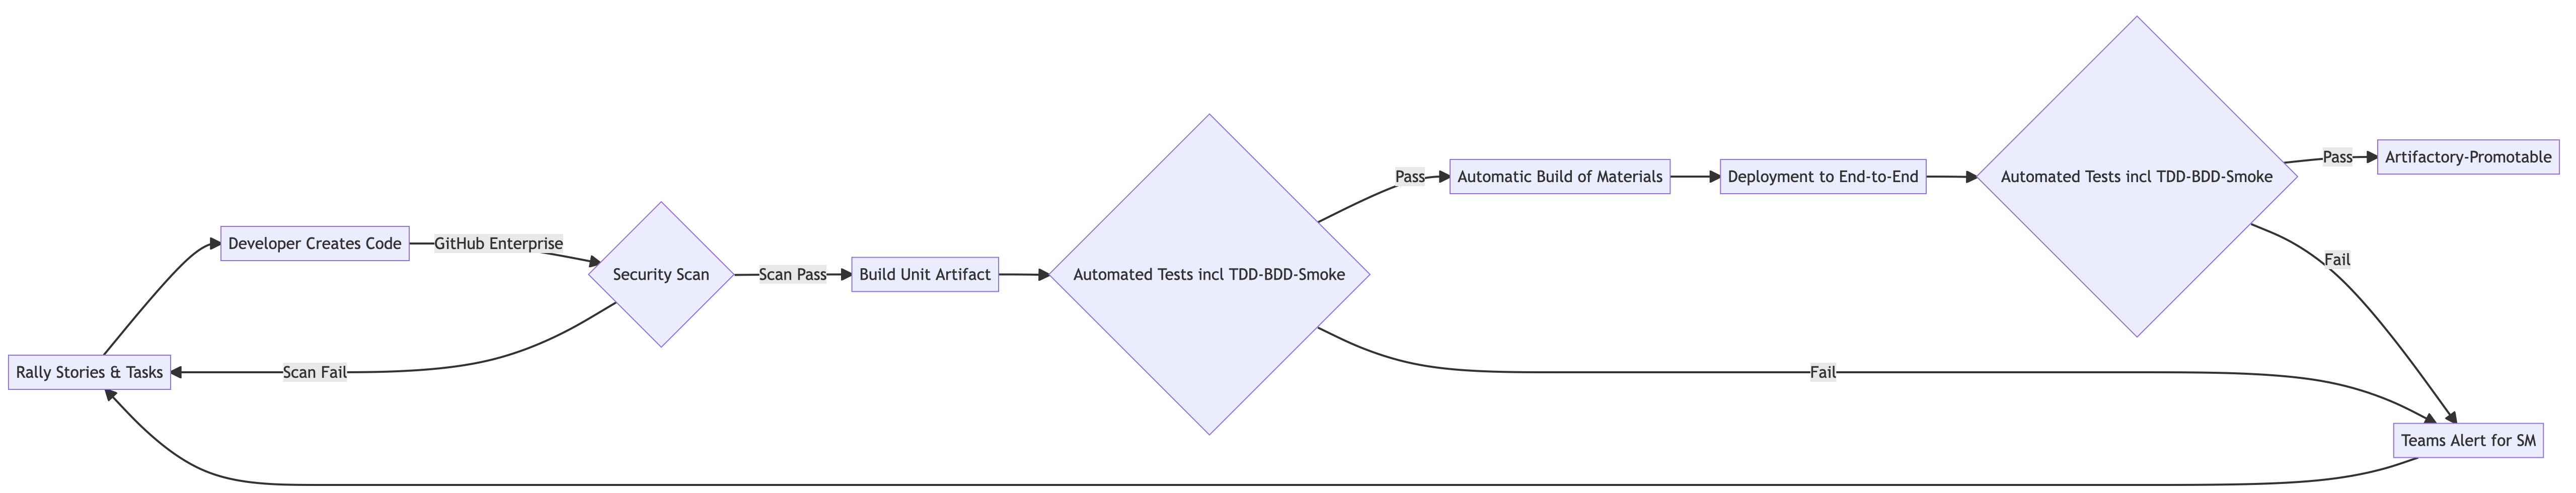
I took an existing process diagram that I created in Lucidchart and translated it into Markdown, and the code looks like this:
flowchart LR
    A[Rally Stories & Tasks] --> B[Developer Creates Code]
    B --> |GitHub Enterprise| C{Security Scan}
    C --> |Scan Fail| A
    C --> |Scan Pass| D[Build Unit Artifact]
    D --> E{Automated Tests incl TDD-BDD-Smoke}
    E --> |Pass| G[Automatic Build of Materials]
    E --> |Fail| F[Teams Alert for SM]
    F --> A
    G --> H[Deployment to End-to-End]
    H --> I{Automated Tests incl TDD-BDD-Smoke}
    I --> |Pass| J[Artifactory-Promotable]
    I --> |Fail| F
Using the Mermaid Markdown parser (available from the Mac or iOS store), you get a simple diagram that looks like this:
But what is really nice, again, depending on your browser support, and underlying OS, if I embed the code above and wrap it in tags, you will get the embedded diagram (above) or you will get raw text, like the code block above (at least in WordPress). What is really nice, is if you check it into Github (change the wrappers), you have live diagrams, that are in version control and can be easily updated as the project or goals change. No more passing around files that cannot be edited, or can only be edited by one person. No more asking is this current. And that makes knowledge transfer easier.
Depending on your browser and OS, what is below is either the diagram, or the code.
flowchart LR
    A[Rally Stories & Tasks] --> B[Developer Creates Code]
    B --> |GitHub Enterprise| C{Security Scan}
    C --> |Scan Fail| A
    C --> |Scan Pass| D[Build Unit Artifact]
    D --> E{Automated Tests incl TDD-BDD-Smoke}
    E --> |Pass| G[Automatic Build of Materials]
    E --> |Fail| F[Teams Alert for SM]
    F --> A
    G --> H[Deployment to End-to-End]
    H --> I{Automated Tests incl TDD-BDD-Smoke}
    I --> |Pass| J[Artifactory-Promotable]
    I --> |Fail| F